
You can ask Sheet Agent to clean up a list, fix a formula, summarize sales or build a tracker in Google Sheets. Choose a task below, copy its prompt and adapt it to your own data.
These 20 prompts are for the chat in the AI for Sheets add-on, not for pasting into spreadsheet cells.
Which prompt do you need?
Choose a task below to find a prompt you can copy and adapt.
How do you use these prompts?
- Open your own spreadsheet, then choose Extensions → AI for Sheets → Sheet Agent. Need the add-on first? Follow the installation guide.
- Choose a task and read its “Before you start” note. You do not need a sample spreadsheet or special tab names. The budget example starts from scratch.
- For a prompt about the current sheet, open the tab containing your data. For a prompt about selected cells, highlight the relevant cells before submitting. Include headers when the example asks for them.
- Replace any text in square brackets with your own details. For cross-tab tasks, enter the actual tab names in this spreadsheet. Then paste the prompt into the Agent chat.
- Run one task at a time and review the result before using it.
Protect your work: selecting cells points the Agent to your data; it does not stop it from editing elsewhere or mean it has already read every cell. Keep the prompt clear about what to change and what to leave alone. If needed, give the actual tab name and cell range. Try edits on a copy of important data first.
Review the result before using or sharing it. The tips below suggest what to look out for.
What does a real Sheet Agent run look like?
Here is one example of turning sales rows into a regional summary. You do not need to recreate this sheet; use the prompts below with your own data.
For this demonstration, we used 10 fictional sales records in J1:M11 and asked for the totals in an empty area, O1:P6. These cell references belong to the example shown here.
The prompt entered in the sidebar is:
Summarize J1:M11 by Region in O1:P6. Include total revenue (£) and a grand total. Change nothing else. Check all 10 rows.
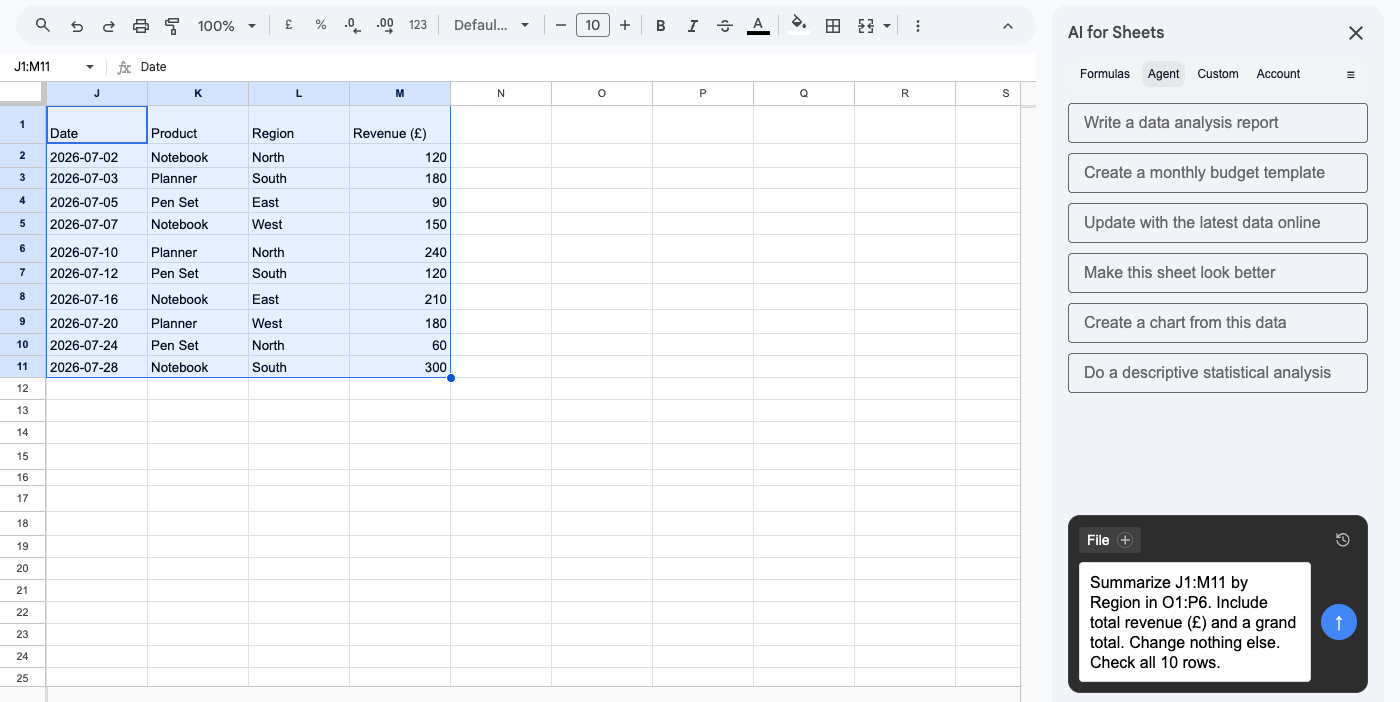
Before: the sales rows are selected and the request is entered in the Agent chat.
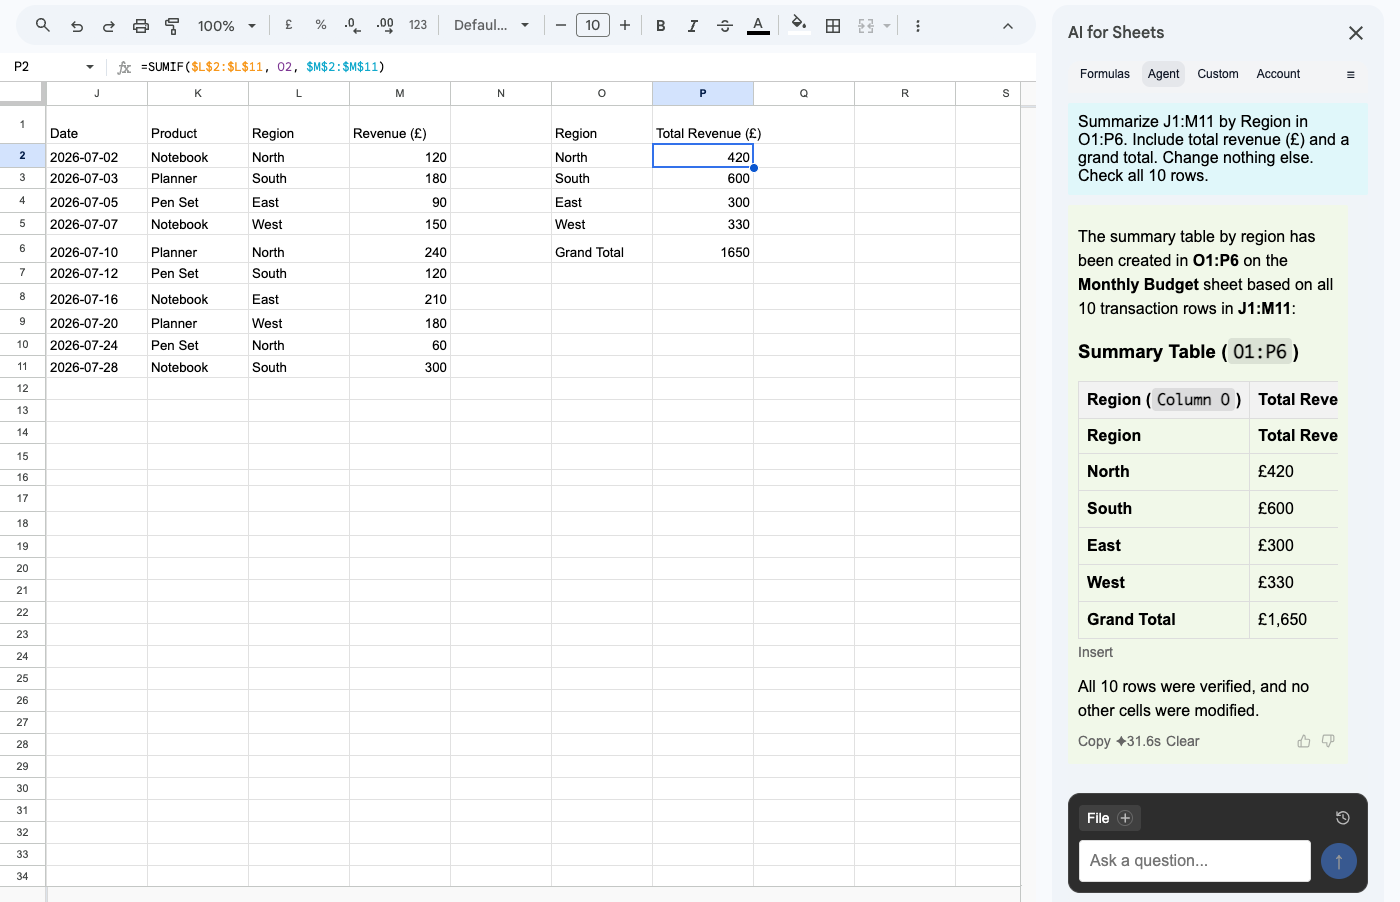
After: a summary shows North £420, South £600, East £300 and West £330, totalling £1,650. We checked the figures and a summary formula against the original data.
Captured on 9 September 2026 in a test version of the add-on, so your version may look or behave differently. The screenshots use fictional data and are cropped for clarity, with no changes to the results. We tested this demonstration, not every prompt below.
How can you clean and reshape data?
Start by flagging problems or creating a cleaned copy. That lets you compare the result with the source before removing anything.
1. Which records are duplicated?
Get a list of possible duplicate contacts without changing your original list.
Before you start: Open your contact list. It needs an ID or email column to match people reliably.
Find duplicate IDs and emails in the contact table on the current sheet, using whichever columns exist. Ask me if the table or columns are unclear.

Ignore blanks. For emails, trim spaces and ignore letter case. List matching rows and reasons in a new tab without overwriting existing content. Keep ID and email matches separate. Leave the original contacts unchanged.
Tip: Review the suggested duplicates before deleting anything. Two people at the same company may be separate contacts.
2. How can you standardize inconsistent dates?
Turn mixed date formats into a consistent list, with uncertain dates set aside for review.
Before you start: Select the date cells you want to clean up.
Clean up only the date cells I selected on the current sheet. Ask me if the selection is unclear.

In a new tab, show each original cell address, original value and cleaned date as yyyy-mm-dd. Flag missing values and dates that could mean either day/month or month/day instead of guessing. Report how many dates were cleaned or need review. Keep the original cells and all existing content unchanged.
Tip: Tell the Agent whether your dates use day/month or month/day so it does not mix up March 4 and April 3.
3. How can you split combined fields into columns?
Separate combined text into columns while keeping a copy of the original entries.
Before you start: Select the cells containing combined text. Replace [separator] with the character between fields, such as a comma or |.
Split only the text cells I selected on the current sheet at [separator]. Ask me if the selection or separator is unclear.

Put the fields in separate columns on a new tab, with each original cell address. Use neutral headings if the fields' meanings are unclear. Trim spaces and keep IDs with leading zeros as text. Flag rows with an unexpected number of fields; do not drop them. Keep all existing content unchanged.
Tip: Keep the original column until you are happy that every entry has been split correctly.
How can you build or troubleshoot formulas?
Explain what you want to calculate. If a formula is broken, ask what went wrong before changing it.
4. How can you calculate profit for each row?
See the profit on each sale without calculating every row by hand.
Before you start: Open your sales table. It needs revenue and cost values for each row.
Calculate profit for each row in the sales table on the current sheet using revenue minus cost. Ask me if the table or columns are unclear.

Put the Profit formulas in an empty column immediately beside the table; check it is empty first. If none is available, ask me where to put them. Leave results blank for missing inputs, accept zero and flag nonnumeric values. Check a few results. Do not overwrite, insert or shift existing columns.
Tip: Try the profit calculation on a few familiar sales before using it for a report.
5. How can you count tasks by owner and status?
See how many tasks each person has and which stage their work has reached.
Before you start: Open your task list with an owner and status for each task.
Count tasks by owner and status in the task table on the current sheet. Ask me if the table or columns are unclear.

Put the counts in a new tab without overwriting existing content. Use my existing status labels without merging different labels. Keep blank owners and statuses as separate groups, and exclude empty task rows. Check that the counts add up to the included tasks. Leave the original table unchanged.
Tip: Keep your status labels consistent so the summary is easy to read.
6. How can you diagnose a broken formula safely?
Understand a formula error before deciding whether to apply a fix.
Before you start: Select a cell or a few cells with a broken formula.
Explain the formula errors in the cells I selected on the current sheet. Read the referenced cells as needed. Ask me if the selection or intended calculation is unclear.

Explain each different error and suggest the smallest fix. Reply in chat only. Do not modify the spreadsheet.
Tip: Ask the Agent to explain the fix before applying it, especially if someone else built the formula.
How can you match records across tabs?
Use a shared ID, such as a product or order number, to connect two lists. Ask for uncertain matches to be flagged rather than guessed.
7. How can you add product details to an order list?
Bring product names and prices into an order list without copying them one by one.
Before you start: Have your order list and product list in two tabs of this spreadsheet. Replace both bracketed tab names below with their actual names.
Match orders in [order tab name] with products in [product tab name] by product ID. Ask me if the tables, IDs, product names or price columns are unclear.

In a new tab, show the original order rows plus product name, unit price and match status. Preserve IDs with leading zeros. Flag missing or duplicate matches instead of guessing. Keep one output row per order. Leave both source tabs and all existing content unchanged.
Tip: Match by product ID rather than name when possible. Similar names can refer to different products.
8. How can you reconcile two exports?
Find missing orders and different amounts across two exports.
Before you start: Put both exports in this spreadsheet, then replace the bracketed tab names with your actual tab names.
Compare orders in [first export tab name] and [second export tab name] by order ID and total. Ask me if the tables, columns or currencies are unclear.

In a new tab, show each ID, both amounts and whether they match, differ or appear in only one export. Treat differences up to 0.01 as matched. Flag blank or duplicate IDs; do not add duplicates together. Report the counts for each result. Keep all existing content unchanged.
Tip: Export the same date range from both systems so the comparison is useful.
How can you summarize and analyze data?
Choose what you want to compare or total. The Agent can describe patterns in your data, but the numbers alone may not explain why they happened.
9. How can you summarize sales by region?
Get regional sales totals and a short summary you can use in a report.
Before you start: Open your sales table with region and revenue columns. This prompt uses all sales rows in that table.
Summarize revenue by region from the sales table on the current sheet. Ask me if the table or columns are unclear.

Put regional totals and a grand total in a new tab without overwriting existing content. Group blank regions as Unassigned and report invalid revenue values. Check the totals against the included sales. Give me three observations in chat without inventing explanations. Leave the original table unchanged.
Tip: Want one month only? Add the month and year to your request, and make sure your table has a date column.
10. How can you flag unusual values without deleting them?
Spot unusually large or small sales that deserve a closer look.
Before you start: Select the revenue values you want to review.
Find unusually high or low revenue values among the cells I selected on the current sheet. Ask me if the selection is unclear.

Use the 1.5 times interquartile range rule and explain the quartile method and cutoffs. In a new tab, list flagged cell addresses, values and reasons. Report missing or invalid values separately. Say if there is too little data for a useful comparison. Flags are not proven errors. Keep all existing content unchanged.
Tip: Use the flagged sales as a review list, not a delete list. An unusually large sale may be genuine.
11. How can you compare two periods?
See which products gained or lost revenue between two months.
Before you start: Open your sales table with date, product and revenue columns. Replace both month placeholders, including the year.
Compare product revenue for [first month and year] and [second month and year] in the current sheet's sales table. Ask me if the table, dates or columns are unclear.

In a new tab, show both totals, the amount changed and percentage change. Include products from either month. Show N/A for percentage change when the first month is zero. Flag invalid dates or amounts and check totals against the source. Keep all existing content unchanged.
Tip: For a new product with no sales in the first month, compare sales amounts rather than percentage growth.
How can you create charts and dashboards?
Turn rows of numbers into a chart or summary you can scan quickly. Start with the figures you want to see.
12. How can you chart monthly revenue?
Turn your sales records into a month-by-month chart.
Before you start: Open your sales table with date and revenue columns. This prompt charts the months covered by your data.
Chart monthly revenue from the sales table on the current sheet. Ask me if the table, date column or revenue column is unclear.

Put a monthly summary and column chart in a new tab. Include every month from the earliest to latest valid date, in order. Label months without records No data, not zero. Report invalid dates or amounts and check the chart against the summary. Keep all existing content unchanged.
Tip: Check your chart against the original data before sharing it.
13. How can you build a small sales dashboard?
Bring your main sales figures and regional performance together in one view.
Before you start: Open your sales table with revenue, cost and region columns. This dashboard uses all sales rows in that table.
Build a dashboard from the current sheet's sales table. Ask me if the table, revenue, cost or region columns are unclear.

In a new tab, show revenue, cost, profit, profit margin and a revenue-by-region chart. Calculate margin as profit divided by revenue; show N/A when revenue is zero. Keep blank regions visible and report invalid rows excluded. Check the totals, state the rows included and whether future rows will be included. Keep all existing content unchanged.
Tip: If you add more sales rows later, make sure the dashboard includes them.
How can you build budgets and expense trackers?
Start a budget from scratch or summarize an expense list you already have. Tell the Agent which currency you use.
14. How can you create a monthly budget?
Start with a blank budget that is ready for your own income and spending.
Before you start: No existing data is needed. Replace [currency] with your currency, such as GBP or USD.
Create a monthly budget in a new tab using [currency]. Ask me if the currency is unclear. Keep all existing content unchanged.

Add a blank income input and editable categories: Housing, Utilities, Food, Transport, Leisure and Other. Include planned spending, actual spending and remaining budget. Leave inputs blank and calculate remaining budget only when both spending inputs are numeric. Add spending totals and income minus actual spending, distinguishing blanks from zero. Make inputs and formulas look different. Do not invent amounts.
Tip: Choose categories that match your spending habits before entering your budget.
15. How can you summarize an expense log?
See where your money goes, with refunds included in the totals.
Before you start: Open your expense log with categories and amounts in one currency. This prompt summarizes all entries in that table.
Summarize spending by category from the expense table on the current sheet. Ask me if the table, columns or currency are unclear.

Treat positive amounts as expenses and negatives as refunds. In a new tab, show category totals and a grand total, keeping blank categories as Uncategorized. Flag invalid amounts rather than counting them as zero. Check the totals against the included expenses. Keep all existing content unchanged.
Tip: For this prompt, enter refunds as negative amounts so they reduce your spending total.
How can you plan schedules and track projects?
See who is doing what and when it is due. A useful plan should also show work that cannot fit into the time available.
16. How can you build a project tracker?
See which project tasks are overdue and how long you have before the others are due.
Before you start: Open your project task list with task names, owners, due dates and statuses. Replace [completed status] with your label, such as Done.
Turn the task table on the current sheet into a tracker in a new tab. Ask me if the task, owner, due date or status columns are unclear.

Keep every task row and add Days until due and Overdue formulas using the spreadsheet's current date. Treat [completed status] as finished. Mark only unfinished tasks with valid past due dates as overdue. Flag missing owners, blank statuses and missing or invalid dates. Keep all existing content unchanged.
Tip: Keep task statuses up to date so finished work does not keep appearing as overdue.
17. How can you plan a week without double-booking?
Spread work across the week and see what cannot fit into your team's available hours.
Before you start: Open a task list with owners, estimated hours and priorities. Replace the start date and daily hours below with your own.
Plan five working days from [Monday start date] using the current sheet's task table. Allow [hours per person per day] hours per owner. Ask me if the table, task details or priority order are unclear.

In a new tab, show owner, date, task and hours. Schedule higher priorities first, splitting long tasks across days. Do not exceed anyone's daily hours. List tasks that cannot fit or have missing or invalid details. Keep all existing content unchanged. Do not create calendar events.
Tip: Adjust the dates and daily hours to suit your team. This creates a plan in Sheets, not calendar bookings.
18. How can you see which deadlines are approaching?
Get a short list of approaching deadlines for your next planning meeting.
Before you start: Open your task list with due dates and statuses. Replace [completed status] with the label your team uses.
List unfinished tasks due in the next 14 days, including today, from the current sheet's task table. Ask me if the table, task, owner, due date or status columns are unclear. Treat [completed status] as finished.

In a new tab, show tasks by due date with owners and days remaining. List overdue tasks separately and flag missing or invalid dates and blank statuses. Keep all existing content unchanged. Do not create reminders or calendar events.
Tip: Use this list at your weekly planning meeting to see what needs attention next.
How can you improve formatting without changing data?
Make your table easier to read while keeping its values and formulas intact.
19. How can you make a table easier to read?
Make a table easier to scan without changing its data.
Before you start: Select the table you want to format, including its header row.
Format only the table I selected on the current sheet. Ask me if the selection or headers are unclear.

Style the header, add alternating row colors and use consistent date and number formats. Ask me before assigning a currency. Preserve values, formulas, IDs with leading zeros and row order. Do not change column widths, freeze rows, merge cells, delete rows or columns, or format outside the selection. List the changes made.
Tip: Tell the Agent which columns contain IDs so values such as 00123 keep their leading zeros.
20. How can you highlight overdue tasks?
Make late tasks stand out so your team can spot them quickly.
Before you start: Select your task table, including its headers. Replace [completed status] with your label, such as Done.
Highlight overdue tasks only within the table I selected on the current sheet. Ask me if the selection, due date or status columns are unclear.

Use a pale-red row highlight for valid dates before today when status is not [completed status]. Exclude headers and blank or invalid dates. Preserve values, formulas and unrelated formatting rules. Do not duplicate a rule. If an existing rule conflicts, explain it and ask me before changing it.
Tip: Use the exact completed-status label from your table, including its spelling.
What should you change when a prompt gives the wrong result?
Tell the Agent what is wrong and what you expected. A specific follow-up is more useful than “fix it”.
For example: “The summary left out rows with no category. Add them as Uncategorized and update the total. Do not change the original data.”
For a new task, use this structure:
Which data → what you want done → where the result goes → what to leave alone → how to check it.
If you need an answer rather than edits, say: “Reply in chat only. Do not modify the spreadsheet.” If information is missing, ask the Agent to identify it rather than fill gaps with invented values.
Should you use Sheet Agent or an AI formula?
Use Sheet Agent for a task involving a table, several tabs or a sequence of spreadsheet operations. Use AI formulas when you want an AI result in a cell that you can fill down, such as a summary or classification for each row.
For the Agent workflow, see how to analyze your spreadsheet data with Sheet Agent. For cell-based examples, see the AI formula prompt library.
Not sure how to adapt one of these examples? Tell us your column headings and the result you want. Use a small anonymized example rather than sharing sensitive spreadsheet data.
Google Sheets™ is a trademark of Google LLC.